Visualize your Facebook network with Gephi
The idea of this post is to make you download your Facebook data so you can create a visualization of your network.
For that, we will use netvizz that allows to extract data from our Facebook, especially what interests us : our friends on Facebook and the connections between them.
Once the «personal network» option is selected, netvizz «scans» our Facebook and offers to download the created file when everything is done.
Two formats are available : gdf and tab
gdf is the format used by GUESS which is a exploratory data analysis and visualization tool for graphs and networks. This is the format we will use with Gephi that handles gdf files (as well as GML, CSV and many more …).
A tip in case of a CRASH
Gephi (0.8.2) may not work correctly with your computer.Indeed, one solution is to replace Java 8 by Java 7 on your computer in the event of a crash without error messages display when starting.
Once Gephi is launched, on we can open the file open the file opened thanks to netvizz.
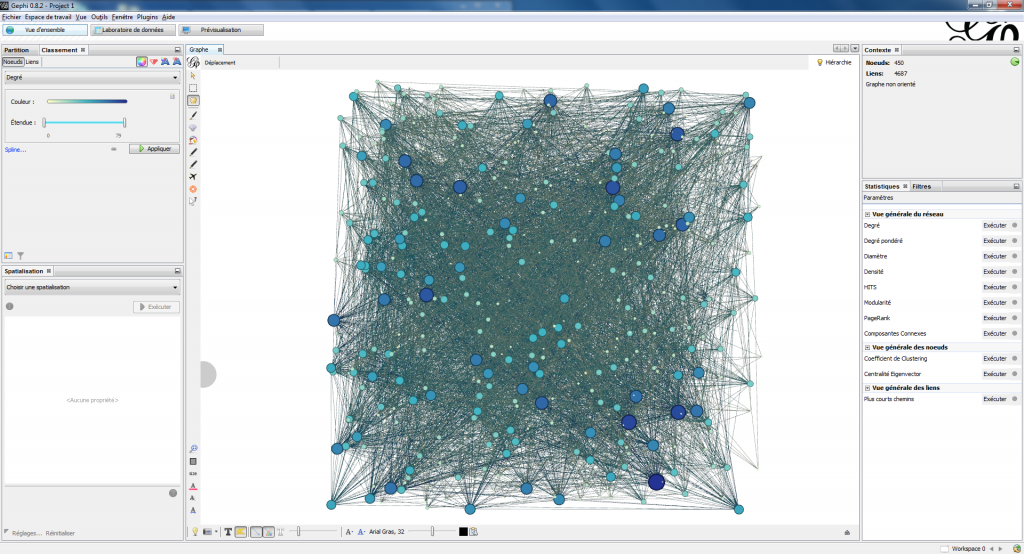
We then have access to details regarding our « extraction »:
- no errors during the import
- number of nodes (your number of friends)
- number of links (total number of connections between your friends).
- dynamic graph ?
- hierarchical graph ?
We can select the type of our graph, «Undirected» because the links deal with friendship and this one is mutual on Facebook.
By clicking on «OK», we have a first visualization of our graph. Next, we can play with it to distinguish different groups between our friends. We can assign a different color to each of the nodes depending on their number of links for example.
We can start by adding a touch of color.
In the left panel, « Ranking » tab.
We want to assign a color to each node (a node ~ a friend).
Therefore we select « nodes » and « degree » and finally the choice for colors. Let’s apply.
We can also play on the size for each node according to the degree.
We kept up to here the organization which we obtain when loading the file in Gephi.
It is also possible to make « live » these nodes thanks to the tab « Layout » into the left panel.
We can choose for example the layout » Force Atlas » or » Force Atlas 2 « . (Explanations ici)
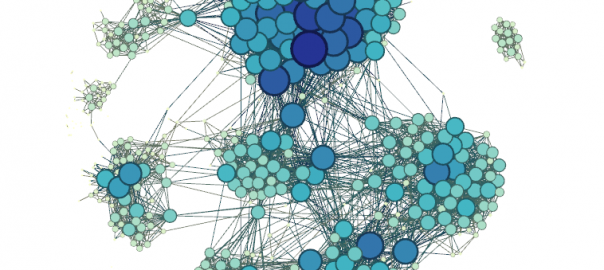
As the name lets us imagine, that reminds manipulations on planets, we can play on the strength of attraction, on the gravity and many more. We visualize groups of our friends being created …
What is interesting here is that everything is about our data.
Indeed, we can distinguish various groups which correspond to various periods of our life. (Primary school, middle school / high school, university, holidays, …)


